


Welcome to Varrd Vision, a weekly newsletter where we summarize important themes in Global Macro and US equity markets to help you prepare for the upcoming trading week. The goal of Varrd Vision is to help investors and traders identify assets on the move, understand why they are moving, and gauge where they may be heading in the future.
None of the following information is investment advice. We share information and statistics that we believe are important to the current market narrative, and our beliefs may change at any moment as new information is released. Any trade ideas mentioned are for educational purposes. The trades we take at VARRD are met with robust risk management techniques, and are likely hedged by other positions in our portfolio.
Summary
Research of the Week:
Model Portfolio Review
Global Macro:
Soybeans
Silver
Keeping it short this week. We review our model portfolio to see where we can gain an edge, and take a look at a couple of setups in futures markets.
Research of the Week
Intro
In Varrd Vision 1/26/2025 we introduced the “Chart Watch” section of the newsletter, where we share charts with great risk-to-reward setups, and ignore any fundamentals or potential catalysts for the asset we are trading.
We have been keeping track of a model portfolio to gauge how well pure charting and technical analysis can perform relative to the overall market. Last week we hit our portfolio stop loss at -7.5% and closed all positions.
We are about 5 months into the experiment, and although we have not collected nearly enough data to begin making any conclusions, our poor relative performance to the S&P has us curious how we can improve our order efficiency and portfolio management.
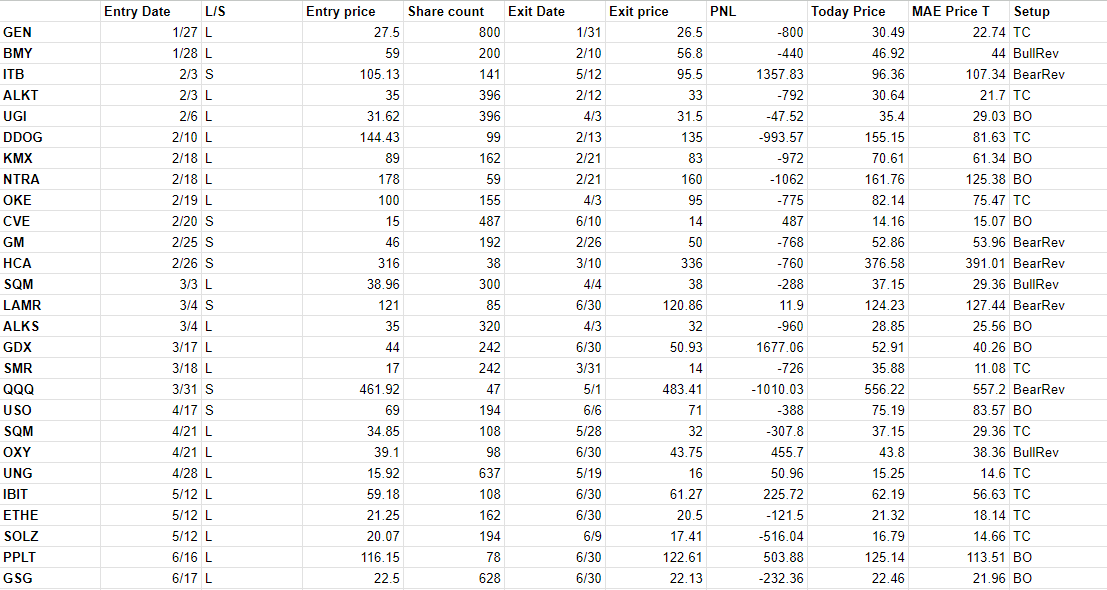
We have been collecting data on each trade so far, and this week we will be running some analysis to help us continue to find our edge. The full dataframe is below.
Summary Stats
We will begin by printing summary stats and charts, and then use this information to reflect and form hypotheses on where our edge is leaking.

Right off the bat we are seeing a huge problem, which is that our average win is smaller than our average loss. A large influence on why charting can be a profitable endeavor is the incredible risk-to-reward setups. A win rate of even 25% can be profitable if winners are consistently larger than losers. At the end of the day, being profitable in trading comes down to the following equation:
E[V] > 0 where
E[V] = (Win rate * Avg win) - (Loss rate * Avg loss)
If we rearrange we get
(Win rate * Avg win) > (Loss rate * Avg loss)
With our current win rate of 30%, we must satisfy
W > (7/3)L or the average win must be 2.33X as large as the average loss. If we can properly identify high-conviction tight-risk spots, there should be no problem satisfying this requirement.
If we control for W/L ratio, with the current ratio of .95 we must have a win rate of 51.3% to be profitable.
So this is where we stand right now. If our win rate remains constant, we need to increase our W/L factor from 0.95→2.33. Or if our W/L factor were to remain constant, we would need to increase our win rate from 29.6%-->51.3%.
Equity Curve
Below is the equity curve equally spaced based on the trade entry date.
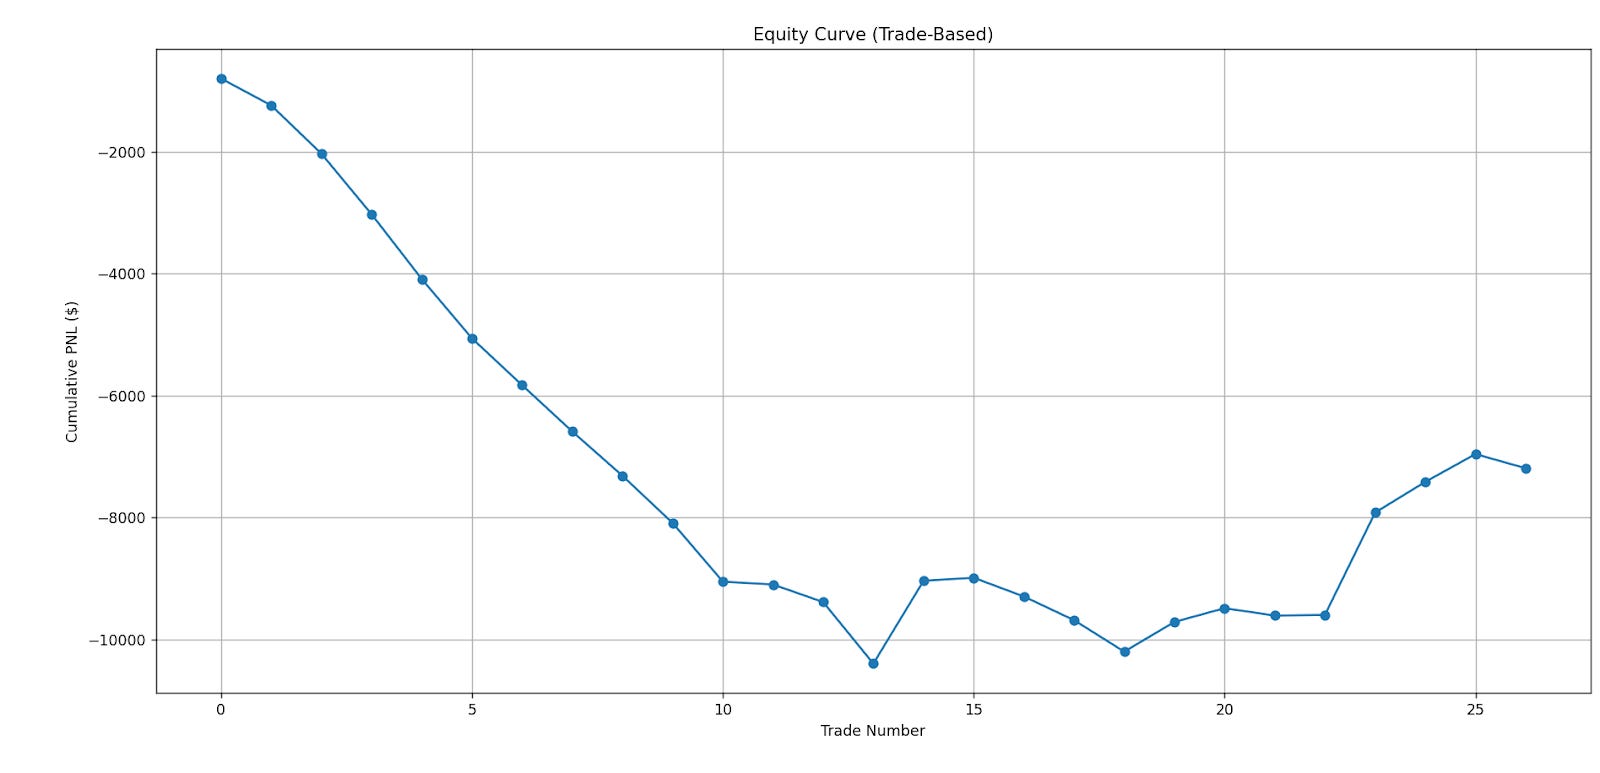
This essentially tells us that the first 13 trades we put on were losers. However, it is encouraging that since this 13th trade, we have not exceeded this drawdown, and we have recovered roughly 25% of our losses.
Trade Type
This first table compares the summary stats for long trades vs short trades.

Both negative, so there are no signs of an edge on the long vs short side.
Next we look at the type of trade.
BO– Breakout trades (breaking out of wedges, bull flags, bear flags)
BearRev– Bullish-to-Bearish reversal trades. When a trend stalls and gives up support at 150 dma.
BullRev– Bearish-to-Bullish reversal. When a stock bottoms and starts to recover the 150 dma.
TC– Trend continuation. Buying pullbacks on bullish trends, selling rallies on bearish trends.

All trade types are negative, so there are no signs of edges within the trade types either. There are insufficient data to run a cross analysis to see if L/S trade types are profitable.
Improvements
One question we have is whether we are cutting some trades too quickly. For example we bought SMR at $17 and stopped out at $14. Just two months later SMR is trading above $40. Given the positive drift of stocks, we would expect long trades to work better with wider stops, and short side trades to work better with tight stops and quicker take profits.
This section we explore “what if” we were to stay in these trades until today. How would the portfolio be performing.
We are specifically interested in the long side, and how much heat these trades took to the downside before becoming a winner. MAE is the maximum adverse exertion, or how much heat we would take if we held through the dip.
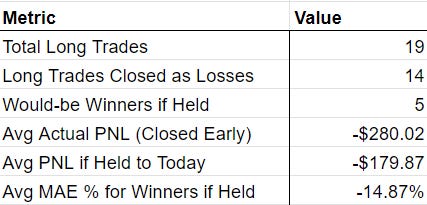
So as a whole, if we were to hold all long trades we would still be negative, even with some of these significant winners like SMR.
Below we look at the 5 tickers that turned into winners after being closed as a loser.

SMR, DDOG, and UGI would be pretty large winners right now if we were still in the trades. However there was significant downside involved with both of these trades. DDOG was down 44% before climbing back to be a 7% winner, which is terrible risk reward. SMR was down 35% before climbing back to be a 112% winner, a 3.2 risk to reward which is exactly what we are looking for.
A stock like SMR is incredibly volatile, with a average daily move of up to 10%. Setting a stop loss within 20% is almost surely going to be stopped out unless we perfectly pick a bottom, which is not the goal with our trade horizon.
One emerging insight is that some of our largest potential winners required enduring substantial downside (e.g., SMR and DDOG). While this violates our preferred stop-loss thresholds, it highlights the need to calibrate stop-losses by volatility regime — tight stops on highly volatile names like SMR will underperform unless entries are extremely precise. Going forward, we’ll explore volatility-adjusted stop placements (e.g., ATR-based).
Trade Distribution
Next we plot the distribution of returns on all trades.

There is a high concentration of trades between -8% and 0%, which means we are taking a lot of small losers. To become profitable, we need a high concentration of 0-8% winners as well. This tells us we can be taking profit quicker if the trade looks like it may be stalling out, or moving stops up quicker to lock in gains.
If we can tie the battle in the middle, meaning we have enough small winners to offset our small losers, then the fat tail winners will generate 100% of our profits. When we set stop losses, we prevent any fat tail losses, and the goal is for this graph to be stretched off the page to the right side in the long run.
Conclusion
This week’s review confirmed what we suspected — that there’s no clear edge yet on the long vs short side, or within our current trade types. But more importantly, we’re starting to understand where our edge might come from.
One key takeaway is that we’re likely cutting some long trades too early, especially in volatile names. While we want to keep stop losses tight to avoid large drawdowns, there’s a cost to exiting before a trade has had time to work. Going forward, we’ll experiment with giving volatile setups more breathing room, potentially using ATR or percentage-based stops that match the character of the stock. With almost every setup we can look to buy deeper or sell higher as well. We will look to improve order efficiency and be more ambitious with how precise our entries can be.
We’re also seeing that we take a lot of small losses in the -5% to -8% range. If we’re going to make that work, we need a similar cluster of +5% to +8% wins. To do that, we’ll be more proactive about locking in gains and moving stops up once trades start to work — especially in slow-grinding names.
Finally, we’ll begin tagging future trades with more structure-based metadata (volatility, consolidation tightness, trend angle, etc.), so we can start to isolate which specific setups within each category are worth pressing. Our current framework is a good start, but the real edge will come from identifying which subset of breakouts, reversals, and continuations are worth betting on.
We’re still early in the process, but every review like this gets us closer to turning technical setups into a repeatable edge.
Global Macro
Still no bias from us on the macro front. Global equities are interesting if the rally can sustain, dollar down is still a comfortable trade, and commodities look favorable on many horizons.
Soybeans
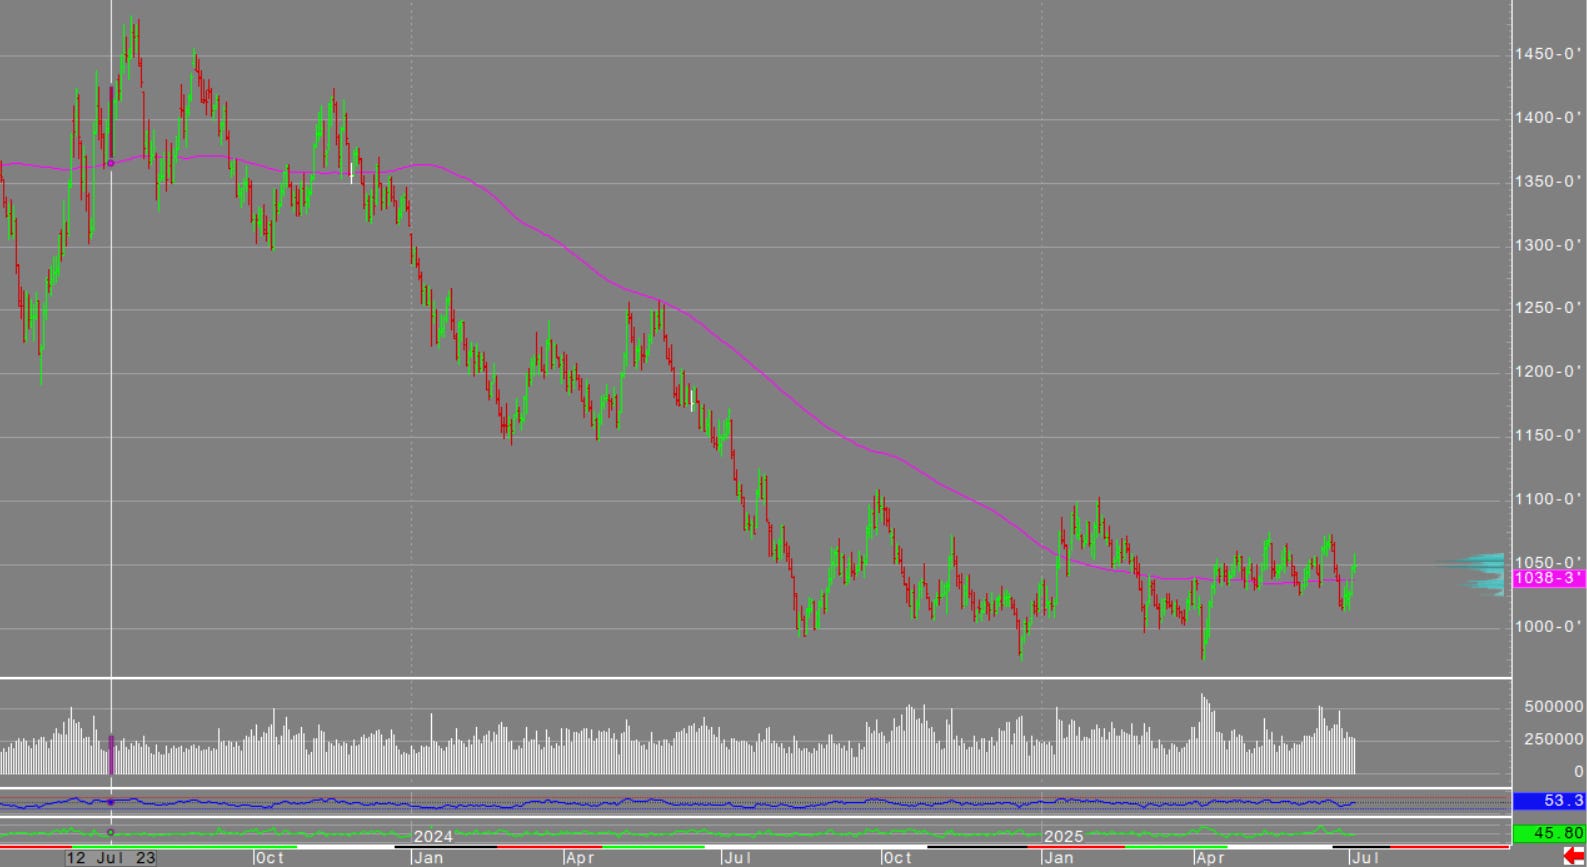
Basing trend reversal in soybeans. We are still believers in the Gleissberg Cycle, and buying dips in grains has been a better idea than buying breakouts.
Silver

Silver has potential to make a violent move up from here. Still long Copper Platinum and Palladium and plan on holding for months or years.
That’s it for this week. Follow us on X to see what we are trading throughout the week and how our views are changing.
Happy 4th of July!